


- ServiceNow SAM Pro tells you what is owned, discovered and installed. Usage tells you what is actually needed.
- Engineering software is licensed below the product level, by features, modules, bundles and tokens, so product-level reporting hides the real cost drivers.
- Putting usage data into ServiceNow changes who can act on it. Procurement, contracts, ITAM and executives use the same data without opening a specialist license-management tool.
8 September 2026. ServiceNow SAM Pro tells you what's owned and installed. It doesn't tell you what's actually used — and for engineering software, that gap decides the renewal.
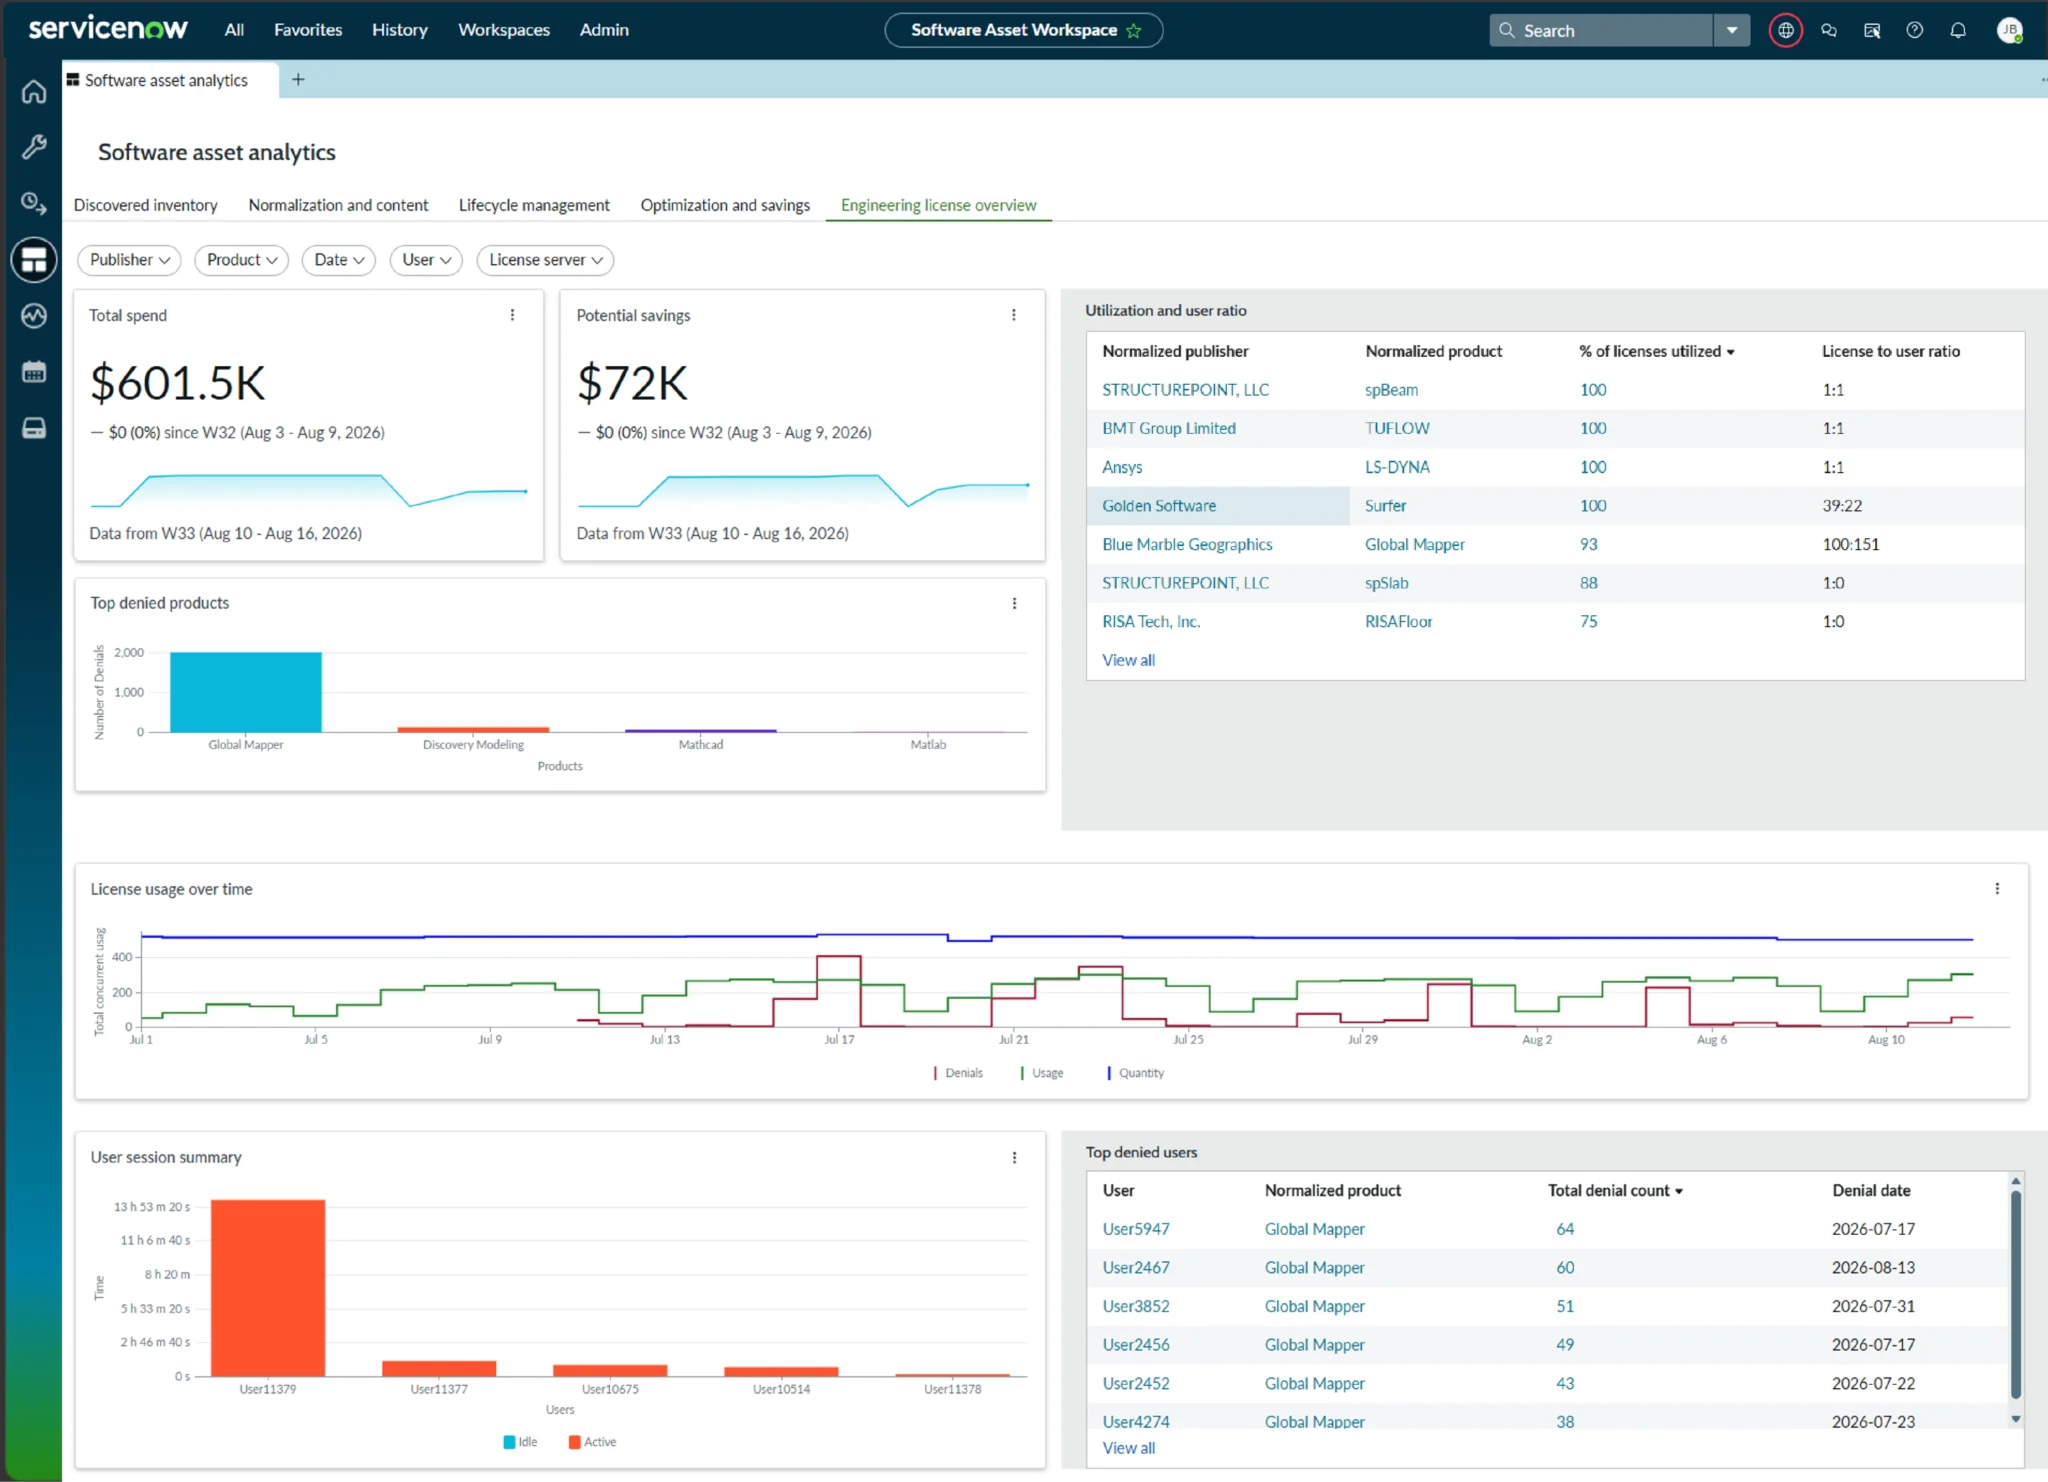
ServiceNow SAM Pro tells you what your client owns and what discovery finds. Engineering software needs one more answer: what people actually use. A license checkout isn’t the same as productive use. Open iT adds the engineering usage layer — users, features, concurrency, denials and active-versus-idle behavior — and brings it into ServiceNow beside the entitlement and cost data already there.
What SAM Pro answers, and what it doesn’t
Every engineering and specialty software renewal comes down to two questions.
What do we own, and what’s installed? SAM Pro answers that one, and it answers it well. Discovery, normalization, reconciliation against the entitlement records: that’s the job, and it’s hard work.
Who actually used it, how often, and how much value did it deliver? An entitlement record was never built to answer that. Compliance tells you what you have. Usage tells you what you need.
The renewal itself is negotiated against a seat count, and one of two parties brings that number to the table. If your client doesn’t have their own usage figure, they’re working from the vendor’s, and the vendor’s figure has never been too low.
Installed is not the same as used
A CMDB can tell you Petrel is installed. It can’t tell you whether anyone worked in it last quarter.
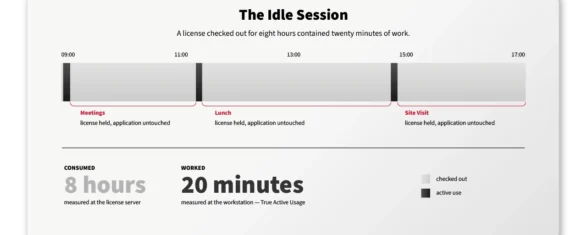
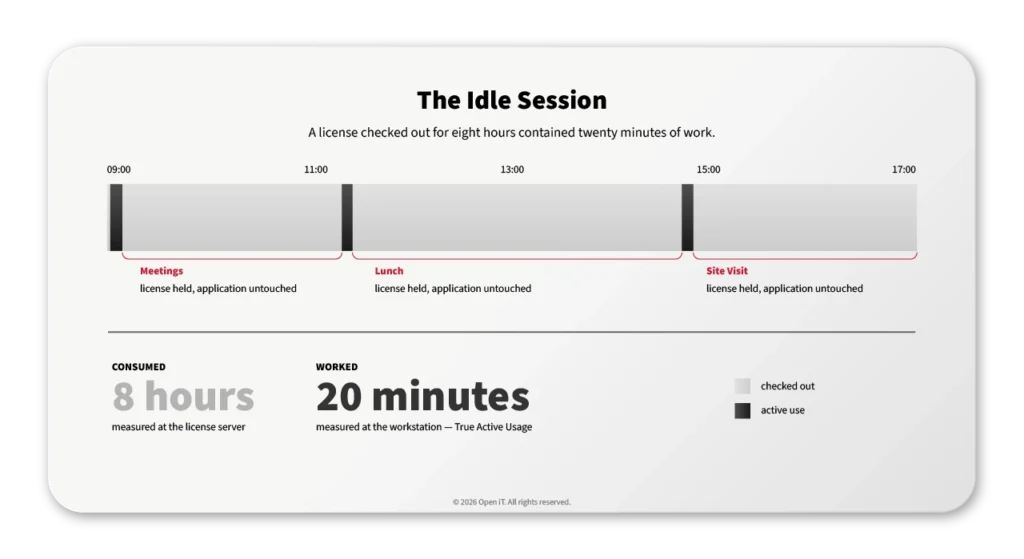
A license checkout gets you closer, but even that can overstate reality. An engineer who opens an application at nine and leaves it running through a meeting, lunch and a site visit has consumed a license all day and used it for twenty minutes. Multiply that by a floating pool and the client is buying capacity for a peak that never happened.
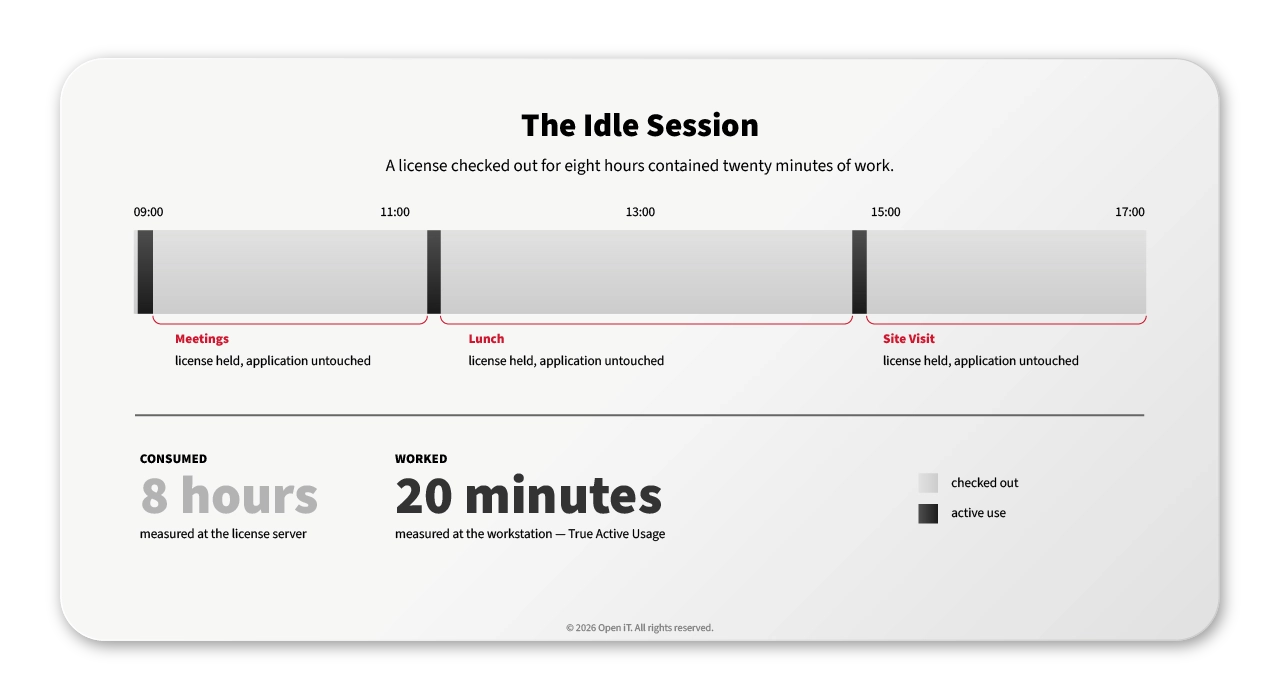
Real usage starts when you separate elapsed license time from active application time. Open iT calls the second number True Active Usage, and the two measurements come from different places.
| What you want to know | Where it’s measured |
|---|---|
| Checkouts, returns, denials, concurrency | The license server |
| Active versus idle behavior inside the session | At the workstation |
Keep the two as separate fields. Consumption comes from the license server. Behavior comes from the workstation.
Cross-link pending: Level 2 collector metrics and the Work Ratio report (docs.openit.com — URL to be confirmed by the Web Admin before publish).
Engineering software doesn’t fit one product line
Engineering applications are usually licensed by feature, by module, by bundle, by token, and often by some combination that changed at the last renewal. One commercial product can hide dozens of distinct usage patterns underneath it.
A feature is one issued license key, and a product can require several. A session doesn’t necessarily hold all of them from start to finish either. One engineer opens the base module and nothing else. Another pulls in two solvers for twenty minutes, then a third runs the whole bundle all afternoon. Same product name on the entitlement record, three different sets of features actually checked out, three different costs.
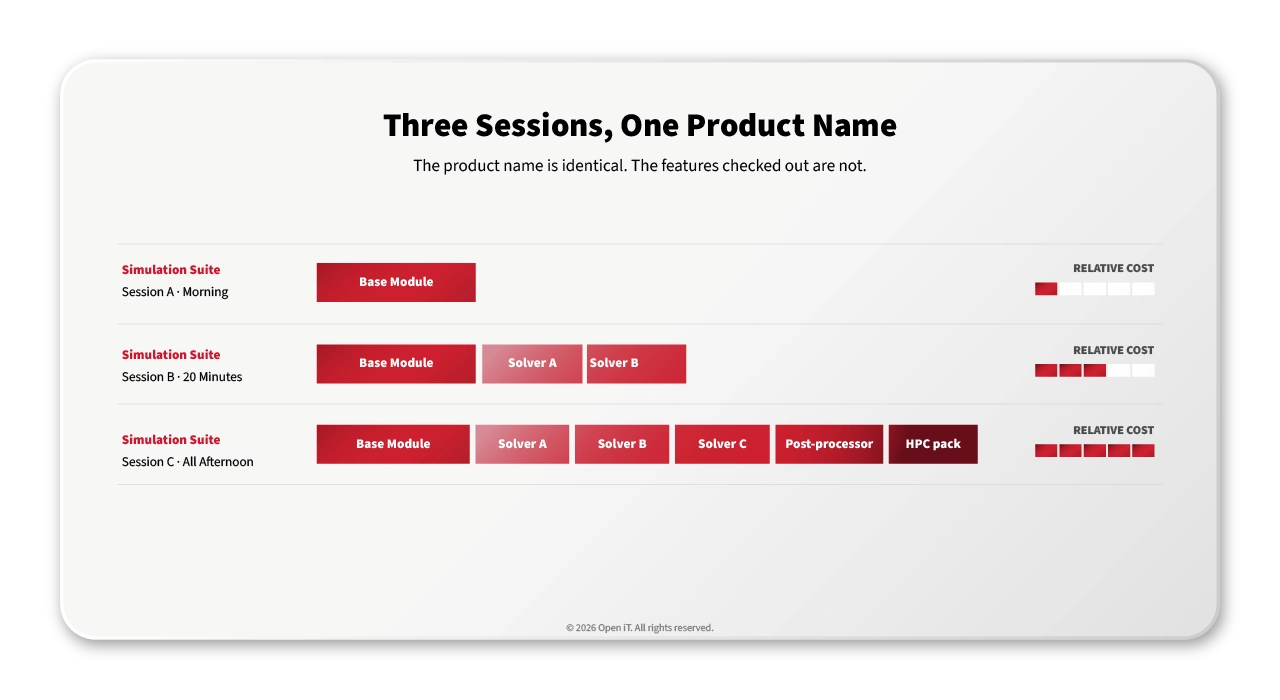
The relationship runs both ways. A single product covers many features, and a single feature can appear in more than one product, priced differently in each. That’s many-to-many, and an asset record built to hold one row per product has nowhere to put it.
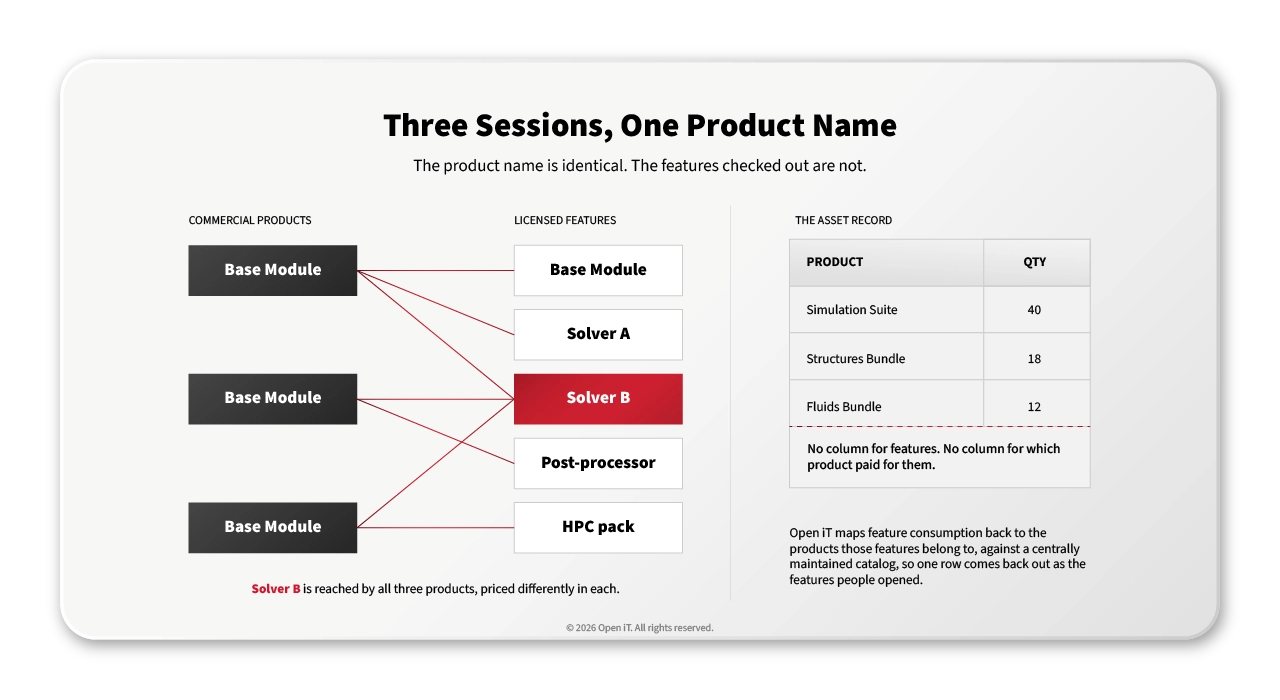
So the report says the client owns the product and uses the product. Both statements are true and neither is useful. What drives the cost sits one level down, in features nobody is reporting on.
Open iT maps feature consumption back to the products those features belong to, against a catalog maintained centrally rather than rebuilt per report. One line in the asset record comes back out as the features people opened.
That translation is the work. Metering a license server is common. Turning feature-level consumption into a commercial product context that procurement can act on is not.
Cross-link pending: feature-to-feature-set mapping (docs.openit.com — URL to be confirmed by the Web Admin before publish).
A concurrent license is not a desktop install
Concurrent licenses live on license servers. They’re checked out, returned, denied and shared between users, sometimes across several servers and more than one time zone for the same application.
Install-based discovery was never built for this. It can see the client installed something, but it can’t see how many people shared the pool on Tuesday, or who was turned away when the pool ran out of licenses.
| Data source | What it tells you | What it can’t tell you |
|---|---|---|
| Install discovery | The software is present on a machine | Whether anyone opened it |
| Entitlement and contract records | What was bought, and what it cost | Whether any of it was needed |
| License server | Which features were checked out, when and by whom, plus denials and peak concurrency | Whether the session was doing any work |
| Workstation | Active and idle time inside the session | What the client is entitled to |
Open iT reads from more than 90 supported license managers, including FlexNet, DSLS, RLM, OLicense and IBM LUM.
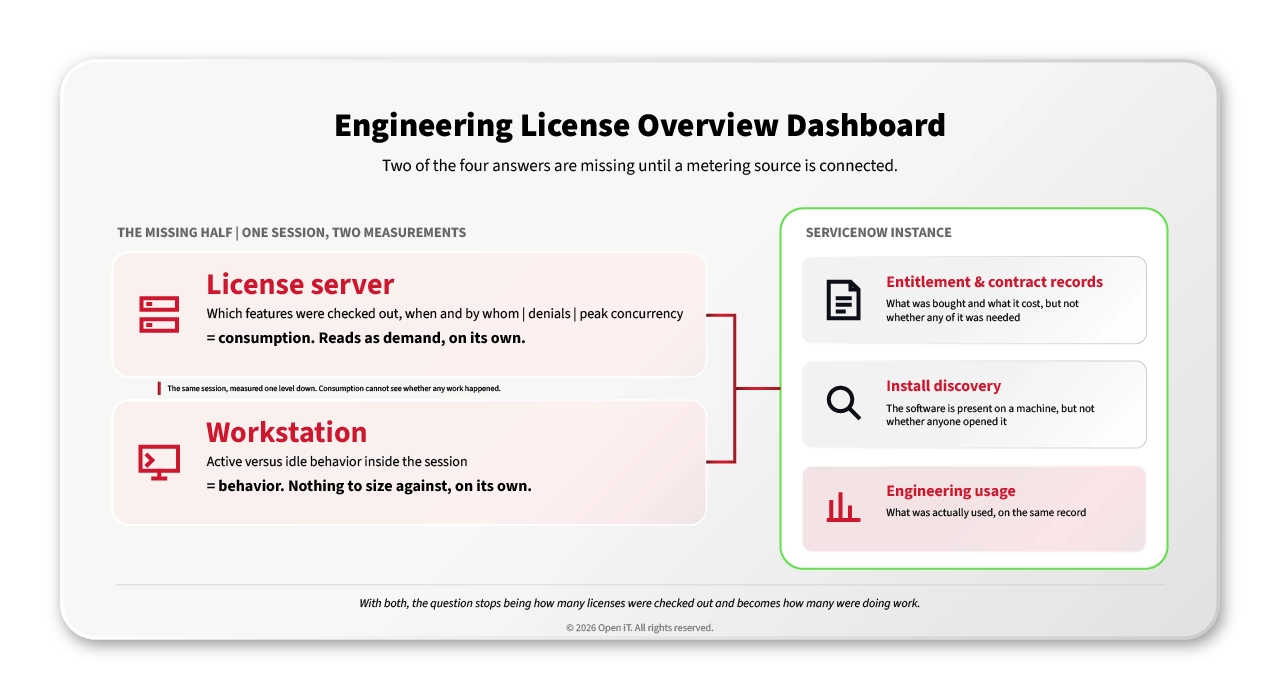
Two of the rows in that table decide whether the client can judge the portfolio at all. The license server tells you what was consumed: which features went out, when, to whom, where concurrency peaked and where denials happened. The workstation tells you what actually happened during that consumption.
Neither answers the portfolio question alone. Consumption on its own reads as demand, but that doesn’t automatically translate into usage — some of the checked-out engineering software may sit idle on the workstation because of a meeting, lunch or a school-run errand. Behavior on its own has nothing to size against.
Empowered with both data streams, the question stops being how many licenses were checked out and becomes how many were doing work. Renew, cut, reclaim or buy: every decision downstream turns on which of those two numbers the client is holding.
Cross-link pending: supported license managers (docs.openit.com — URL to be confirmed by the Web Admin before publish).
Put the data in ServiceNow and different people start using it
The biggest benefit is not another dashboard. It is a different audience.
In-house, it usually goes like this: a licensing specialist builds a monthly workbook. It’s good work. Two colleagues read it. Procurement opens it about a fortnight before a renewal, or doesn’t. Contracts management has never opened it, and neither has anyone above them, because nobody told them the workbook exists.
Those same people are in ServiceNow before their first coffee.
Once engineering usage sits there too, the data moves from specialist analysis into business decisions. A contracts manager can act on it without learning a new tool or asking anyone for an export. Nothing about the report improved. The readership did.
Three workflows that get better when usage sits beside the asset record
Vulnerability response. The Log4j pattern, and it recurs every few months under a different name. Identify the affected applications, find the owner, contact the vendor, notify the users. That last step needs a current view of who actually uses the application. Install counts will warn people who haven’t opened it in a year and miss the contractor who uses it daily.
Support load. Support teams can compare ticket volumes against real user populations rather than install counts. The answer is rarely the one the team expects. Tickets clustered among new or occasional users point at training, not at the software.
Renewal. Procurement walks in with evidence rather than an opinion: utilization, demand, and the named people behind both. Wherever in the world those users sit, procurement can reach them and ask what the seat is for.
Usage turns an asset record into a decision record.
What Open iT adds
Open iT doesn’t replace SAM Pro. It doesn’t manage entitlements, contracts or hardware, and it doesn’t do discovery.
It adds one layer: engineering usage. True Active Usage and automated license harvesting, coverage across engineering applications, license managers and SaaS, centralized license server monitoring, and the forecasting and simulation that sit on top of it. Collected by LicenseAnalyzer™ and delivered into the instance beside the commercial data already there.
| Open iT | ServiceNow |
|---|---|
| Captures engineering usage depth: True Active Usage, features, concurrency, denials, coverage across 90+ license managers and SaaS | Turns it into governed SAM action: reconciles usage against entitlements, contracts and spend, and routes consumption and denial signals into workflows somebody owns |
ServiceNow’s own framing of the split, from the joint webinar: Open iT captures engineering usage depth, ServiceNow turns it into governed SAM action. The platform combines that usage with entitlements, contracts and software spend, reconciles it against what the client owns, and converts consumption and denial signals into workflows somebody actually owns.
The value is in bringing them together.
Going to Nexus for Asset Management?
If your customers run engineering software, the interesting question is no longer just what they own. It is what they actually use.
[CTA placeholder — pending event dates and booking link for Nexus for Asset Management. Do not publish live with this placeholder in place.]