


IT Asset Management
Savings Calculator
An interactive calculator that estimates how much money you could save – All in less than a minute.
Struggling with IT asset management inefficiencies? Whether you’re an IT Asset Manager battling hidden license waste, a Procurement Manager negotiating blind, or an Engineering Manager stuck with bottlenecks, the challenge is the same—unseen inefficiency costs you time and money.
Open iT
The IT Asset Management Savings Calculator gives you instant visibility into wasted spend, potential savings, and ROI — all in just minutes.
If you’ve ever wondered how much money is quietly slipping away in unused licenses, you’re not alone. In this article, you’ll discover how the Open iT license savings calculator — and our proven ITAM solutions — can turn hidden waste into measurable savings.
What Is IT Asset Management and Why Does It Matter? (H2)
IT asset management (ITAM) is the structured practice of tracking, managing, and optimizing all the technology assets an organization owns or uses — including hardware, software licenses, cloud subscriptions, and related resources. At its core, ITAM ensures that businesses have the visibility and control they need to maximize the value of their investments, reduce waste, and stay compliant with vendor and regulatory requirements.
For many organizations, software licensing alone represents a significant share of IT spend. Without proper oversight, companies risk over-licensing (paying for software they don’t use), under-licensing (facing compliance risks and potential fines), or misallocation (critical tools not available to the right teams when needed). Effective IT asset management helps strike the right balance — ensuring resources are purchased, deployed, and used efficiently.
Beyond cost control, ITAM also plays a critical role in operational efficiency and governance. It provides accurate data for budgeting and forecasting, supports vendor negotiations with real usage insights, and ensures organizations meet compliance requirements. In industries with expensive engineering or enterprise applications, software license optimization by just a few percentage points can translate into millions in savings annually.
In short, IT asset management matters because it enables companies to:
- Cut unnecessary IT costs by identifying waste.
- Stay compliant with licensing agreements and audits.
- Improve productivity by ensuring the right tools are always available.
- Make data-driven decisions about future IT investments.
By treating ITAM not just as an IT function but as a strategic business discipline, organizations can transform their technology landscape into a driver of financial and operational performance.
Ready to see how much waste is hiding in your software portfolio?
Four (4) Reasons Why Companies Overspend on Software Licenses (H2)
Software licenses represent one of the largest ongoing costs in IT budgets, yet many organizations consistently spend far more than they need to.
The root cause isn’t usually overspending on purpose — it’s the lack of visibility and control over how licenses are actually being used.
1. Unused or Forgotten Licenses (H3)
In many enterprises, licenses are purchased for projects, teams, or individual employees and then never fully deployed. Staff turnover, role changes, or project completions often leave software license management seats idle.
Without regular monitoring, these unused licenses keep renewing year after year, draining budgets without delivering value.
2. Low Utilization Rates (H3)
Even when licenses are technically “in use,” license utilization is often much lower than expected. For example, an engineering team might hold 100 simulation licenses, but only 40% are actively engaged at peak times.
The result is a significant gap between what is purchased and what is truly needed — leading to underutilization and wasted spend.
3. Lack of Visibility Across the Organization (H3)
One of the biggest challenges is that most IT and procurement teams lack clear, centralized data on software licensing consumption. Different departments manage their own software, usage data is fragmented across systems, and reporting is often incomplete.
This lack of visibility makes it difficult to identify waste, negotiate better vendor terms, or right-size license pools.
4. Compliance Pressures Lead to Overbuying (H3)
To avoid the risk of non-compliance or failing a vendor audit, organizations often over-license “just in case.”
While this strategy reduces audit risk, it often locks companies into contracts that significantly overshoot actual demand.
Companies overspend on software licenses because they don’t have the right tools to measure actual usage, track utilization trends, and optimize purchasing decisions. Without visibility, the default is to buy more than necessary — leading to inflated IT costs and wasted resources.
This is where solutions like the Open iT license savings calculator can help — by giving organizations a clear picture of their true utilization and highlighting immediate cost-saving opportunities.
Stop paying for licenses you don’t use.
How the IT Asset Management Savings Calculator Works (H2)
Follow the simple steps to discover how much license waste you can cut — and how much savings you can unlock.
Step 1: Enter Your Details (H3)
Provide key information about your organization’s software usage:
1. Industry Type (H4)
We tailor output using sector-specific utilization benchmarks (e.g., manufacturing, automotive, energy). Choose also the application vendors in this industry type.
2. Annual Revenue (H4)
Helps scale the ROI estimate relative to organization size and operational scope.
3. Number of Users or Engineers (H4)
Quantifies the base of your license usage environment.
4. Total Annual License Costs for the Selected Vendors (H4)
Sets a baseline for how much you’re spending on the selected vendor.
5. Answer the Monitoring Question (H4)
Do you currently use any specific solutions to monitor and manage software asset management? Please tick Yes or No.
6. Read and Confirm the Disclosure (H4)
Check the box to confirm:
“All figures calculated are based on industry IT spend averages and anonymized customer data collected by Open iT.
By proceeding, you agree to the collection of your data for the purpose of calculating ROI and accept the Terms and Conditions of this site.”
7. Review Your Entries (H4)
Please verify that all input data is correct to ensure an accurate Open iT calculation.
8. Click “Calculate” (H4)
Click Calculate to generate your results.
9. Make Changes if Needed (H4)
If you want to make changes, click Clear to reset the fields (or edit any field and click Calculate again).
These inputs shape a customized, data-driven overview of your software spend and optimization potential.
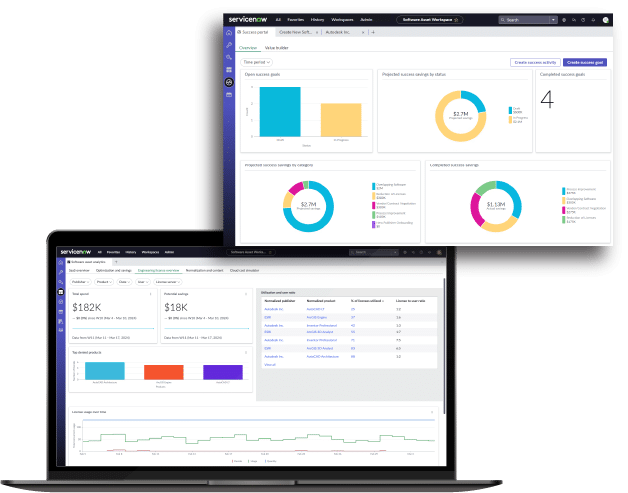
Step 2: View Your Instant Results (H3)
Within moments, the calculator displays clear and easy-to-read visuals of your estimated savings and costs:
1. Projected Savings Graph (H4)
- A bar chart showing your Maximum Savings, Minimum Savings, Software Cost, and Reduced Cost.
- This gives you a quick visual comparison between your current spending and potential savings opportunities.
2. Year-by-Year Breakdown (H4)
A detailed table and chart showing:
- Year 1 Savings
- Reduced Cost vs. Current Software Cost
- Cumulative Savings over 3 Years
- Savings per Engineer (if applicable)
Includes both numerical values and a pie chart for easy interpretation.
This immediate view helps you understand your potential savings at both a strategic (multi-year) and tactical (per engineer or license) level.
Step 3: Access Your Full ROI Report (H3)
When you click “Get the Full Report” inside the calculator, here’s what happens next:
1. Fill in Your Details (H4)
Enter your Name, Company, and Email Address in the form provided.
This information is required because your detailed report will be sent directly to the email address you provide.
Make sure the details are correct to avoid delivery issues.
2. Confirmation Email (H4)
You’ll immediately receive a thank-you email from the Open iT Team.
This email confirms your request and explains how Open iT helps organizations maximize the value of their software licenses.
3. Scroll to Download Link (H4)
The confirmation email itself does not display your detailed savings data.
Scroll down to find a secure link labeled “Open iT Software ROI Report.”
4. Download Your PDF Report (H4)
Click the link to download your PDF report. Inside, you’ll find:
- Year-by-Year Cost & Savings Breakdown
- Key Business Outcomes
- Visual Projections
By collecting your details up front, Open iT ensures that the ROI Report is securely delivered and ready for you to share with IT, procurement, or finance teams.
Fill the gap of your organization with Open iT's products and services.
Example for IT Asset Management Savings Scenario (H2)
Imagine a global automotive manufacturer that designs and tests vehicles using advanced engineering software like CATIA, ANSYS, MATLAB, and 3DEXPERIENCE. With over 1,200 engineers worldwide, the company invests heavily in software licenses to keep innovation running smoothly.
But here’s the problem: despite spending more than $15 million annually on engineering licenses, only a fraction of them are actively used at any given time. Idle licenses pile up, renewal contracts get bloated, and procurement teams struggle to negotiate without usage visibility.
The result? Millions of dollars in hidden waste every year.
Here’s how the Free IT Asset Management Savings Calculator works in a real-world case.
Sample Inputs (H3)
- Industry Type: Automotive
- Application Vendors:
Dassault Systèmes (CATIA, 3DEXPERIENCE), Ansys (simulation software), and Siemens (NX, Teamcenter)
- Annual Revenue: $2.5 Billion
- Number of Engineers: 1,200
- Total Annual License Cost: $15 Million
Sample Outputs (H3)
Year 1 Results (H4)
- Software Cost: $15,000,000
- Reduced Cost: $9,300,000
- Annual Savings: $5,700,000
- Savings per Engineer: ~$4,750
Interpretation:
In the first year, the company is overpaying by 38% of its license costs due to idle or underutilized software license management.
By right-sizing license pools and reallocating idle seats, Open iT can help reduce costs to $9.3M, generating $5.7M in direct savings.
Projected 3-Year View (H4)
- Year 1 Savings: ~$5.7M
- Year 2 Savings: ~$5M (conservative estimate as license pools stabilize)
- Year 3 Savings: ~$5.2M
- Cumulative 3-Year Savings: ~$16M
Interpretation:
Over three years, the company avoids $16M in wasted software spend, freeing up budget for innovation, R&D, or additional engineering capacity.
ROI and Benchmarking (H3)
- ROI: High — estimated at 40–50%+ in Year 1 alone.
- Industry Benchmarking: The company’s license utilization rates are below the automotive average (typically 65–70%). Closing this gap drives immediate and lasting savings.
Why This Matters (H3)
For automotive enterprises with heavy reliance on simulation and design software:
- Every idle license can cost $10,000–$20,000 per year.
- With 1,200 engineers, even a 10% utilization improvement translates into millions saved annually.
- Optimized licensing reduces bottlenecks, ensuring engineers always have access when needed — improving both productivity and cost efficiency.
This real-world scenario shows how a $15M annual license spend can be cut by $5.7M in the first year alone.
With cumulative savings of $16M in three years, the IT Asset Management Savings Calculator reveals the hidden cost of license waste — and how Open iT helps enterprises turn that waste into measurable ROI.
See how your organization compares.
Five (5) Benefits of Using the Calculator for IT Asset Management (H2)
The Open iT license savings calculator is more than a simple tool — it’s a fast, data-driven way to uncover opportunities for better IT asset management (ITAM).
By combining your organization’s inputs with industry benchmarks and proven optimization models, the calculator delivers immediate insights that support smarter business decisions.
1. Quick and Actionable Insights (H3)
Get immediate visibility into your software license optimization and costs without waiting for lengthy audits or manual reporting.
The calculator delivers results in minutes, helping IT, procurement, and finance teams identify where waste exists.
2. Cost Savings Potential (H3)
By quantifying unused or underutilized licenses, the calculator shows how much budget can be reclaimed.
Even modest improvements in software asset management can mean six- or seven-figure savings.
3. ROI Visibility (H3)
Executives need hard numbers to make investment decisions. The software ROI calculator provides clear ROI estimates, making it easier to justify budget allocations.
4. Industry Benchmarking (H3)
Compare your utilization rates against anonymized industry peers (see Gartner ITAM Insights).
This highlights opportunities for competitive advantage.
5. Smarter Vendor Negotiations (H3)
With usage insights, procurement teams gain leverage when negotiating renewals or true-ups.
By showing actual usage patterns and savings opportunities, the calculator helps organizations secure better contract terms and avoid overspending.
Want to strengthen your next vendor negotiation?
Get Your Full ROI Report (H2)
Get the complete picture of your potential savings with a detailed ROI report delivered straight to your inbox. This comprehensive report goes beyond the instant calculator results to give you:
1. Year-by-Year Savings Breakdown (H3)
The report provides a 3-year projection of:
- Software Cost (your current spend baseline)
- Reduced Cost (optimized spend after removing unused/underutilized licenses)
- Annual Savings (budget reclaimed each year)
- Cumulative Savings (total 3-year impact)
In the snapshot: Year 1 alone shows $5.7M in savings, Year 2: $4.7M, Year 3: $5.1M — for a total of over $15.6M saved.
2. Key Business Outcomes (H3)
The report highlights strategic benefits of acting on these insights:
- Minimize software expenditures by cutting waste and negotiating better vendor contracts.
- Prevent unexpected expenses by avoiding audit penalties and over-licensing.
- Achieve budget predictability with clearer financial planning.
This isn’t just about saving money — it’s about making IT costs predictable and defensible in front of CFOs and boards.
3. Visual Projections (H3)
The included charts and visuals make it easy to:
- Compare maximum vs. minimum savings scenarios.
- Understand the financial risk of “doing nothing” (inaction costs).
- Share findings with non-technical stakeholders.
For example, the snapshot shows the expense of inaction at $223K per month — that’s a persuasive data point for executives.
4. Proof & Confidence (H3)
- The report is positioned as more than a one-off calculation — it’s a decision-support tool:
- Based on anonymized industry data + benchmarks.
- Backed by Open iT’s proven track record with Fortune 500 clients.
Why Download It? (The Purpose) (H3)
- For IT Asset Managers: Proof of hidden waste + visibility into usage inefficiencies.
- For Procurement Managers: Negotiation leverage with hard usage data.
- For Engineering Managers: Assurance that engineers won’t face license bottlenecks.
- For Executives (CIO/CFO): Clear ROI projections to justify budget and ITAM investments.
The purpose is not just to show “what you could save” but to give you hard evidence you can use in:
- Boardroom budget discussions
- Vendor contract negotiations
- Internal IT asset management strategy planning
The ROI Report moves beyond a calculator snapshot into a boardroom-ready business case. It quantifies waste, proves ROI, and gives executives the confidence to act — making it the first step toward enterprise-wide license optimization.
Best Tools for IT Asset Management Best Practices to Maximize Savings (H2)
Discover the Top 10 IT asset management best practices to maximize savings. Each best practice comes with challenges — and see how Open iT’s tools turn those challenges into opportunities.
1. Centralize IT Asset Data (H3)
Consolidate all asset information—hardware, software, cloud services—into a single source. Centralization eliminates blind spots, ensures better visibility, and prevents duplicate purchases.
Challenge: Data is scattered.
Solution: Open iT Enterprise Analyzer consolidates license usage into one dashboard.
2. Optimize Software Licensing (H3)
Regularly review license usage to right-size your license pools. Reallocate or harvest idle licenses, consolidate contracts where possible, and purchase only what’s proven to be needed.
Challenge: Companies overbuy.
Solution: LicenseAnalyzer enables right-sizing and harvesting of idle licenses.
3. Continuously Monitor Utilization (H3)
Adopt real-time usage monitoring tools instead of relying on one-off audits. Ongoing visibility ensures faster adjustments to demand fluctuations and avoids overspending.
Challenge: One-time audits don’t capture trends.
Solution: LicenseMonitor tracks real-time license activity.
4. Strengthen Vendor Management (H3)
Use detailed utilization reports in vendor negotiations. This evidence-based approach helps secure fairer contract terms, reduce unnecessary “true-ups,” and improve compliance confidence.
Challenge: Negotiations lack data.
Solution: Vendor Analysis Reports (powered by LicenseAnalyzer + Analyzer for Cloud) – provides vendor-specific cost and usage reports.
5. Automate License Reharvesting (H3)
Implement policies that automatically reclaim unused licenses after a set idle period. This practice boosts utilization rates while ensuring employees always have access when needed.
Challenge: Idle licenses sit unused.
Solution: LicenseAnalyzer with License Reharvesting Module – automatically reclaims unused licenses for redeployment.
6. Align ITAM With Business Strategy (H3)
Integrate ITAM goals with broader business objectives. Share utilization and savings reports with finance and executives to guide budget planning, compliance efforts, and digital transformation initiatives.
Challenge: ITAM is siloed.
Solution: SystemAnalyzer creates executive-ready reports.
7. Forecast Future Needs With Analytics (H3)
Use historical usage data to predict future license demand. This proactive approach helps avoid emergency purchases, ensures resources are available when needed, and reduces overspending on unused capacity.
Challenge: Can’t predict demand.
Solution: Analyzer for Cloud & Forecasting Module.
8. Implement Role-Based Access Controls (H3)
Ensure licenses are allocated to employees based on role requirements. This prevents unnecessary license distribution and supports security compliance.
Challenge: Misallocated licenses.
Solution: LicenseAnalyzer with policy-based controls.
9. Perform Regular Compliance Audits (H3)
Schedule internal audits to confirm license usage against vendor terms. Staying compliant avoids costly fines, reduces audit anxiety, and positions IT as a governance leader.
Challenge: Fear of vendor audits.
Solution: Analyzer with Compliance Dashboards.
10. Invest in ITAM Tools and Automation (H3)
Manual processes cannot scale in enterprise environments. Dedicated ITAM solutions like Open iT automate usage metering, chargeback/showback, reporting, and license optimization—delivering consistent cost savings over time.
Challenge: Manual processes can’t scale.
Solution: Full Open iT Suite.
Why Choose Open iT for IT Asset Management (H2)
Open iT’s Suite of ITAM solutions
-
LicenseAnalyzer
-
LicenseMonitor
-
Optimizer
-
SystemAnalyzer
-
Analyzer for Cloud
FAQ About IT Asset Management Savings (H2)
1. What is IT asset management savings and how do I calculate it? (H3)
Savings refer to reductions from optimizing IT resources. The license savings calculator estimates unused license costs, projected savings, and ROI.
2. How accurate is an ITAM savings calculator?
Very accurate when inputs (license count, cost, utilization) are realistic and benchmarked.
3. What counts as unused software licenses?
Licenses purchased but idle — projects ended, role changes, or forgotten renewals.
Trusted by

VersionBay
VersionBay helps other companies reduce the risk and quantify the value of migrating to newer versions of MATLAB.

Mitta Oy
One of Mitta Group’s subsidiaries, is a company based in Finland that specializes in providing consultancy services to the construction industry.

Fortune 500
A large industrial conglomerate in energy and light metals sought to assess its computer resource usage to better manage IT expenditures.